
 Kontakt
 Jak kupować
Dostawa
Doradca ds. zakupów
 Angielski
 248 b
248 b
najlepszej
ceny ▸
Nawet do 30 dni na zwrot
Klienci kupili także












 /
/
 Miękka
 9.19
€
9.19
€












 /
/
 DVD
17.99
€
DVD
17.99
€





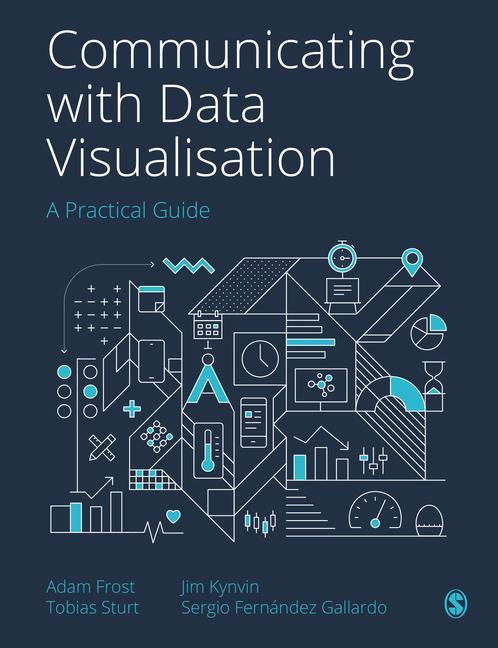
How can you transform a spreadsheet of numbers into a clear, compelling story that your audience will want to pass on?
This book is a step-by-step guide (honed through the authors' Guardian masterclasses, workshops and seminars) to bringing data to life through visualisations, from static charts and maps to interactive infographics and motion graphics.
Introducing a four-step framework to creating engaging and innovative visualisations, it helps you to:
· Find the human stories in your datasets
· Design a visual story that will resonate with your audience
· Make a clear, persuasive visual that represents your data truthfully
· Refine your work to ensure your visual expresses your story in the best possible way.
This book also includes a portfolio of best-practice examples and annotated templates to help you choose the right visual for the right audience, and repurpose your work for different contexts.


Informacje o książce
Angielski

Podaruj tę książkę jeszcze dziś
To łatwe
1 Dodaj książkę do koszyka i wybierz „dostarczyć jako prezent” 2 W odpowiedzi wyślemy Ci bon 3 Książka dotrze na adres obdarowanegoMogłoby Cię także zainteresować
















 /
Miękka
15.09
€
/
Miękka
15.09
€



 /
Miękka
23.79
€
/
Miękka
23.79
€

Cześć! Jestem Libroamiko, Twój doradca książkowy.
Jak mogę Ci pomóc?